How to visualize your geospatial outputs with DroneMaps
How to visualize my outputs by selecting a dataset
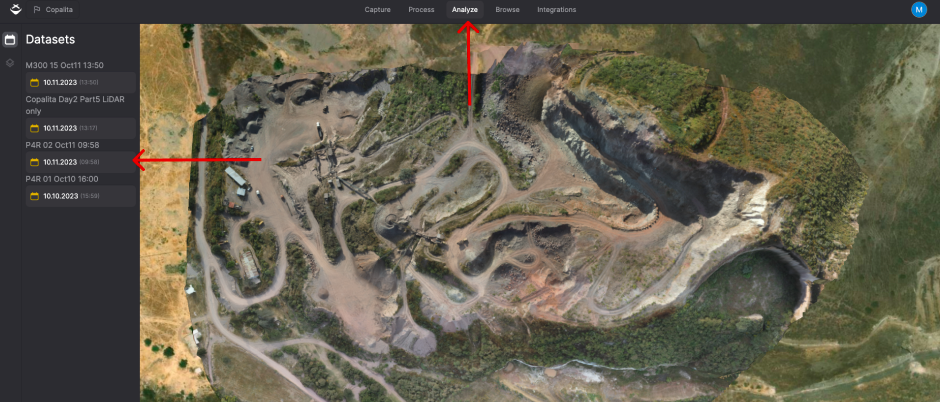
Step 1: Select Your Dataset
- To get started, click on "Analyze" tab located at the top of the screen.
- Within the "Analyze" section, find and click on the dataset icon located in the column on the left.
- Navigate through your dataset to find the specific one you're interested in.
- Click on the desired dataset to proceed.
Step 2: Visualize by Layers
- Once you've selected your dataset, you'll be directed to the visualization screen.
- Here, you can explore your dataset in various layers, including 3D Mesh, Point Clouds, Orthophoto, and Base Map.
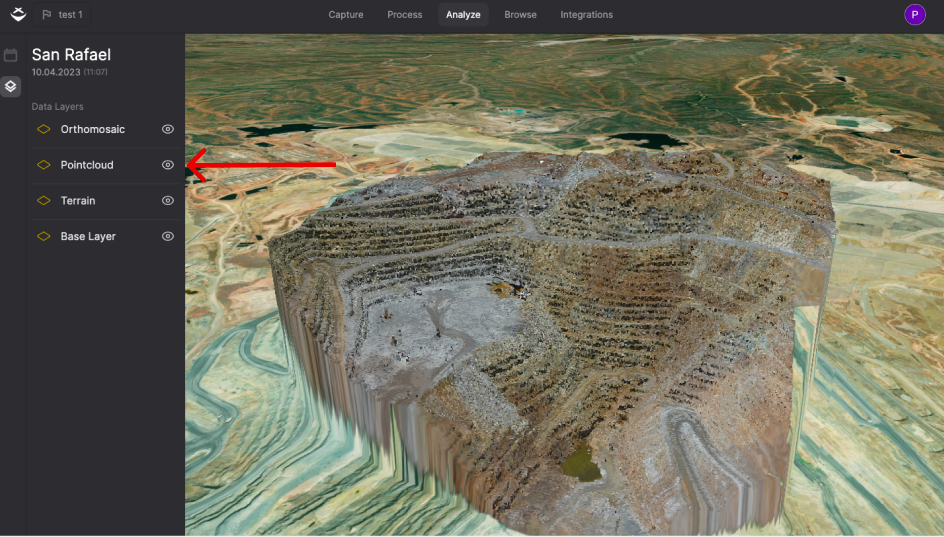
Step 3: Hide Layers
During the process of transitioning between layers, you have the flexibility to hide specific outputs on your map. To do this:
- Locate the "eye" button next to each configuration.
- Click the "eye" button to hide the output.
- Conversely, click the same "eye" button to display the configuration on the map again.
This simple feature allows you to declutter your map view, focus on specific data, and streamline your geospatial visualization.
Tips and Best Practices
Layers Explained
DroneMaps offers a wide array of geospatial layers for you to explore and gain insights from. These layers include:
- 3D Mesh: Visualize your dataset in a 3D mesh format, which provides a detailed three-dimensional representation of the terrain.
- Point Cloud: Access a point cloud representation of your data for in-depth analysis and precision.
- Orthophoto: Utilize high-resolution, georeferenced orthophotos to obtain a detailed view of the landscape, which can be invaluable for various applications.
- Base Map: Enhance your geospatial visualization with a base map for better contextual awareness.
Visualize your dataset from the "Browse" Tab
You're not limited to accessing your datasets only from the "Analyze" tab. We've made it even more convenient for you. Here's how to get started:
- Begin by clicking on the "Browse" tab located at the top of the screen. This will take you to your file browser.
- Within the file browser, you can filter and search for your specific sites or datasets.
- Once you've found the desired site, click on it to view the available datasets within.
- After selecting your site, you'll have access to the datasets that are ready for visualization.
- Find the dataset you want to work with and click on the "Open in Viewer" option associated with that dataset.
These capabilities provide you with the flexibility to effortlessly explore your geospatial data directly from the "Browse" tab and visualize your processed datasets in the viewer. Maximize the utility of your geospatial insights and make the most of your data with Dronemaps.
What's Next?
Now that you've mastered the art of geospatial visualization, let's explore what's next on your journey.
To maximize the utility of your geospatial data, you can consider exporting it in various formats. Here are some options:
- Orthophoto: Export your dataset as an orthophoto, a high-resolution, georeferenced image that provides a detailed view of the landscape.
- Point Cloud: Create a point cloud representation of your data
- Raw Photos: Export the raw photos captured in the mission
- 3D Mesh: Generate a 3D mesh representation of your geospatial data
These export options enable you to share your insights and collaborate with others effectively.
Need more help? contact us for support